The goal of the assignment is to explore quadratic fuction in the form y = ax² + bx + c in which the values for b and c are fixed and a vary.
1. Several quadratic functions were explored where a ranged between -4 and 4 and b = 1 and c = 2
2. Try an animation for the same range.
3. Is there a common point to all graphs? What is it? What is the significance of the graph where a = 0? Do similar interpretations for other sets of graphs. How does the shape change? How does the position change?
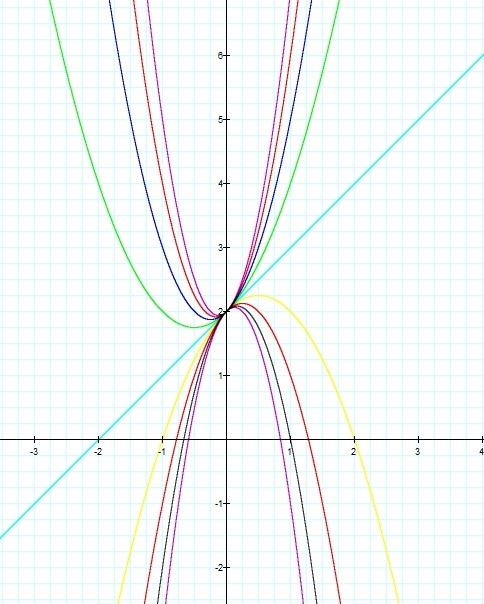
1. The analysis of varying a between 4 and -4 in the above functions revealed that:
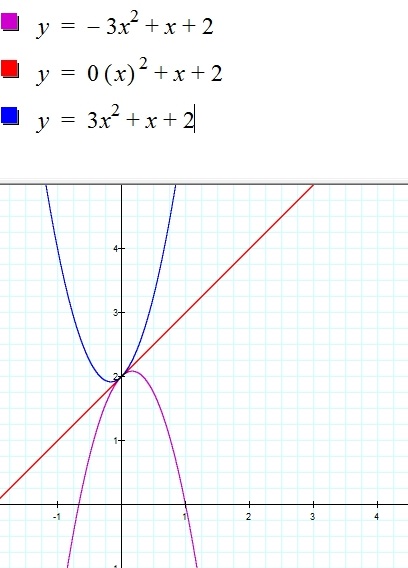
a. For positive values of a the parabola opens upwards and for negative values of athe parabola opens downwards.
b. As the positive value of a approaches 0, the graph widens and turns into the straight line y = x + 2, when a = 0. Likewise, as the negative values of a approaches zero the graph widens and turns into the straight line y = x + 2. Why? When a = 0, the quadratic term in the function is eliminated and the highest degree in our function is now 1. That is, all that remains of the original function is the linear term and constant term. In our case, x + 2.
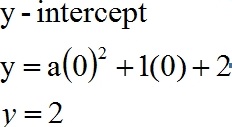
c. Each of the above function cuts the y-axis at 2.
2. Animation for y = nx² + x + 2:
3a. Is there a common point to all graphs?
Yes, the common point is 2.
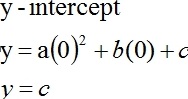
b. What is it?
2 is the c of the function in the form y = ax² + bx + c. Considering real numbers for a, b, and c, a quadratic function written in this form has a constant value c. The graph will always cut the y-axis at this value.
c. What is the significance of the graph where a = 0?
When a = 0, a line is generation from the quadratic function. When comparing two quadratic function with fix b and c and a being same numbers with opposite signs; There is some form of transformation taking place about this line. It appears to be some form of reflection and rotation about that line. As demonstrated below:
d. Do similar interpretations for other sets of graphs.
Animation for y = nx² + 2x +1
Similar patterns were noticed here to the animation in part 2. When a = 0
the parabola callapses to a straight line y = 2x + 1. The intercept is c and the chance in a
widen or narrowed the graph.
e. How does the shape change?
How wide or narrow a graph is determined by the change in a
f. How does the position change?
c affect the vertical positioning of the quadratic functions.